Configuring Tables and Pivot Tables
Overview
Tables are one of the most effective ways to present structured data, offering a familiar and organized grid layout. They facilitate comprehensive analysis and comparison of individual data points, making them perfect for scenarios where precise values and granular details are crucial.
Getting Started
Before configuring a Table, ensure you have:
- Access to a dataset that contains the data you wish to analyze
- A clear goal for your analysis
- Understanding of the data structure
Business Value
- Display specific metrics in organized format
- Support decision-making through detailed comparisons
- Enable granular data analysis
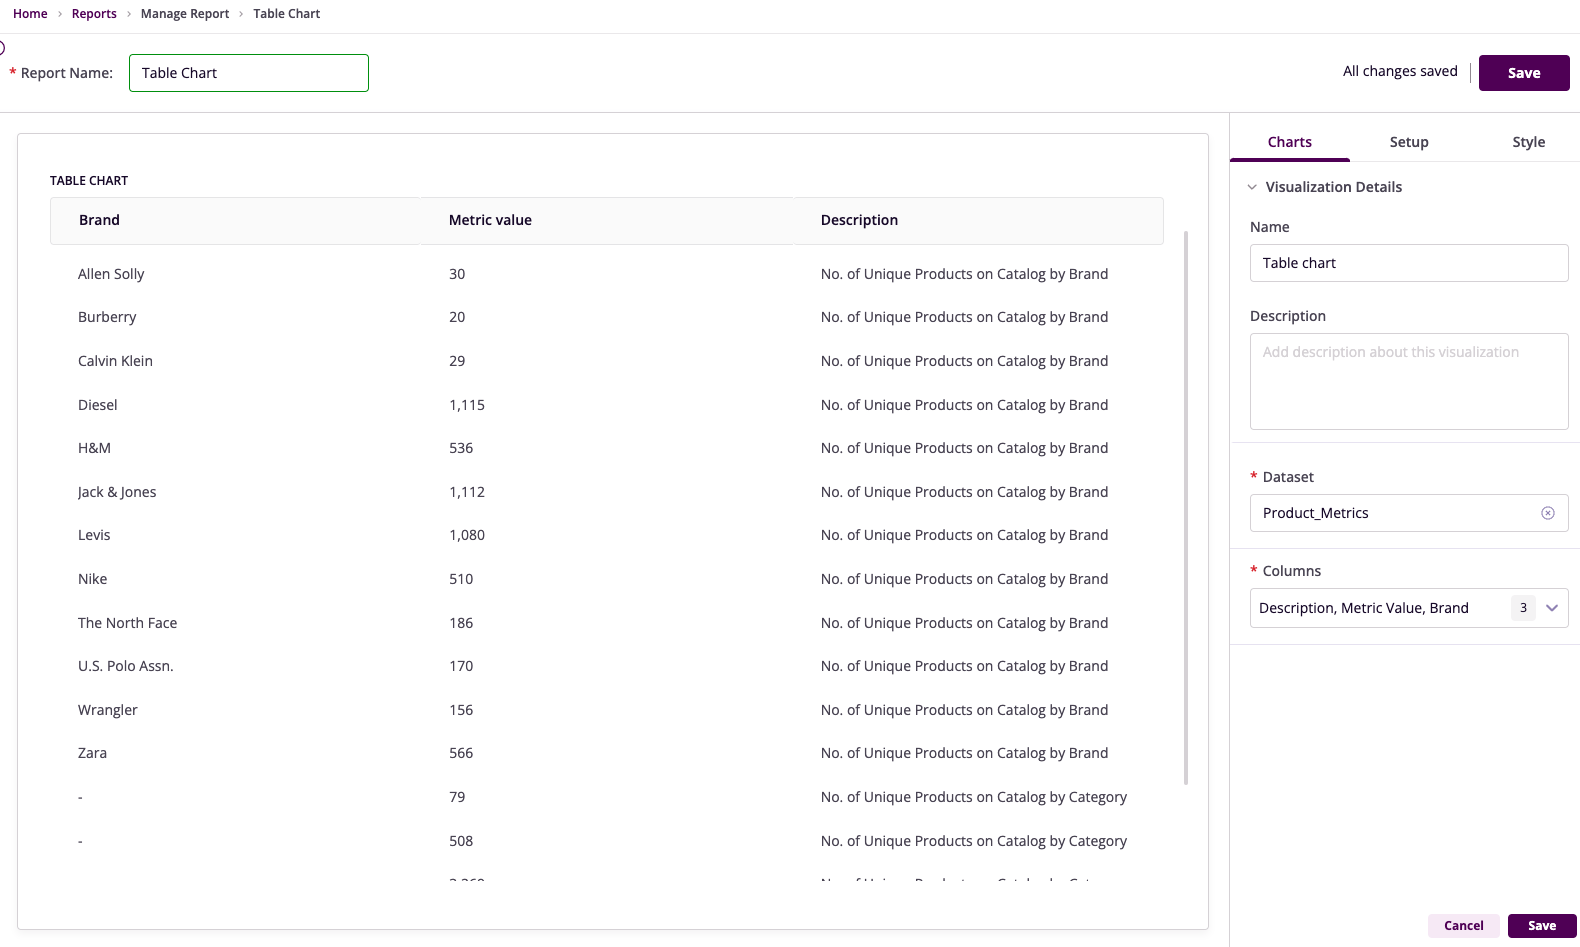
Table Configuration
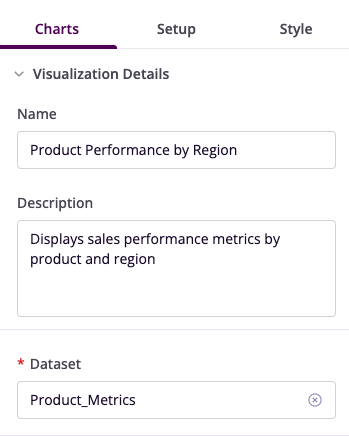
Basic Configuration
- Name: Provide a descriptive title
- Description: Add context about purpose
- Dataset: Select relevant dataset
Column Selection
- Choose specific columns to display
- Arrange columns in logical order
- Configure column properties
Filter Configuration
- Operation: Choose conditional operator
- Field: Select column to filter
- Value: Set filter criteria
- Operator: Combine multiple filters
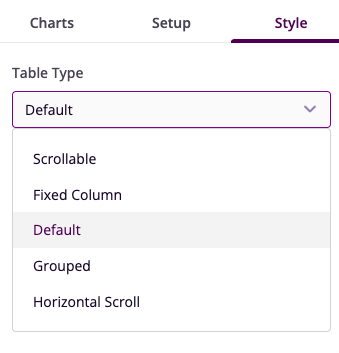
Style Customization
- Table Type: Choose format (Scrollable/Fixed/Grouped)
- Visual Settings: Configure appearance
- Layout Options: Set scroll behavior
Example Use Cases
Sales Summary Table
- Columns: Product Name, Sales, Units Sold, Revenue
- Filters: Revenue >= 1000
- Style: Scrollable format
- Insight: Product performance analysis
Regional Performance Table
- Columns: Region, Total Sales, Market Share, Profit
- Filters: Market Share >= 5%
- Style: Fixed column format
- Insight: Regional performance comparison
Pivot Table Configuration
Basic Setup
- Name: Set descriptive title
- Description: Explain purpose
- Dataset: Choose data source
Structure Configuration
- Rows: Select and order fields
- Columns: Define column structure
- Values: Set aggregation methods
Advanced Features
- Filters: Refine data display
- Sorting: Arrange data logically
- Formatting: Customize appearance
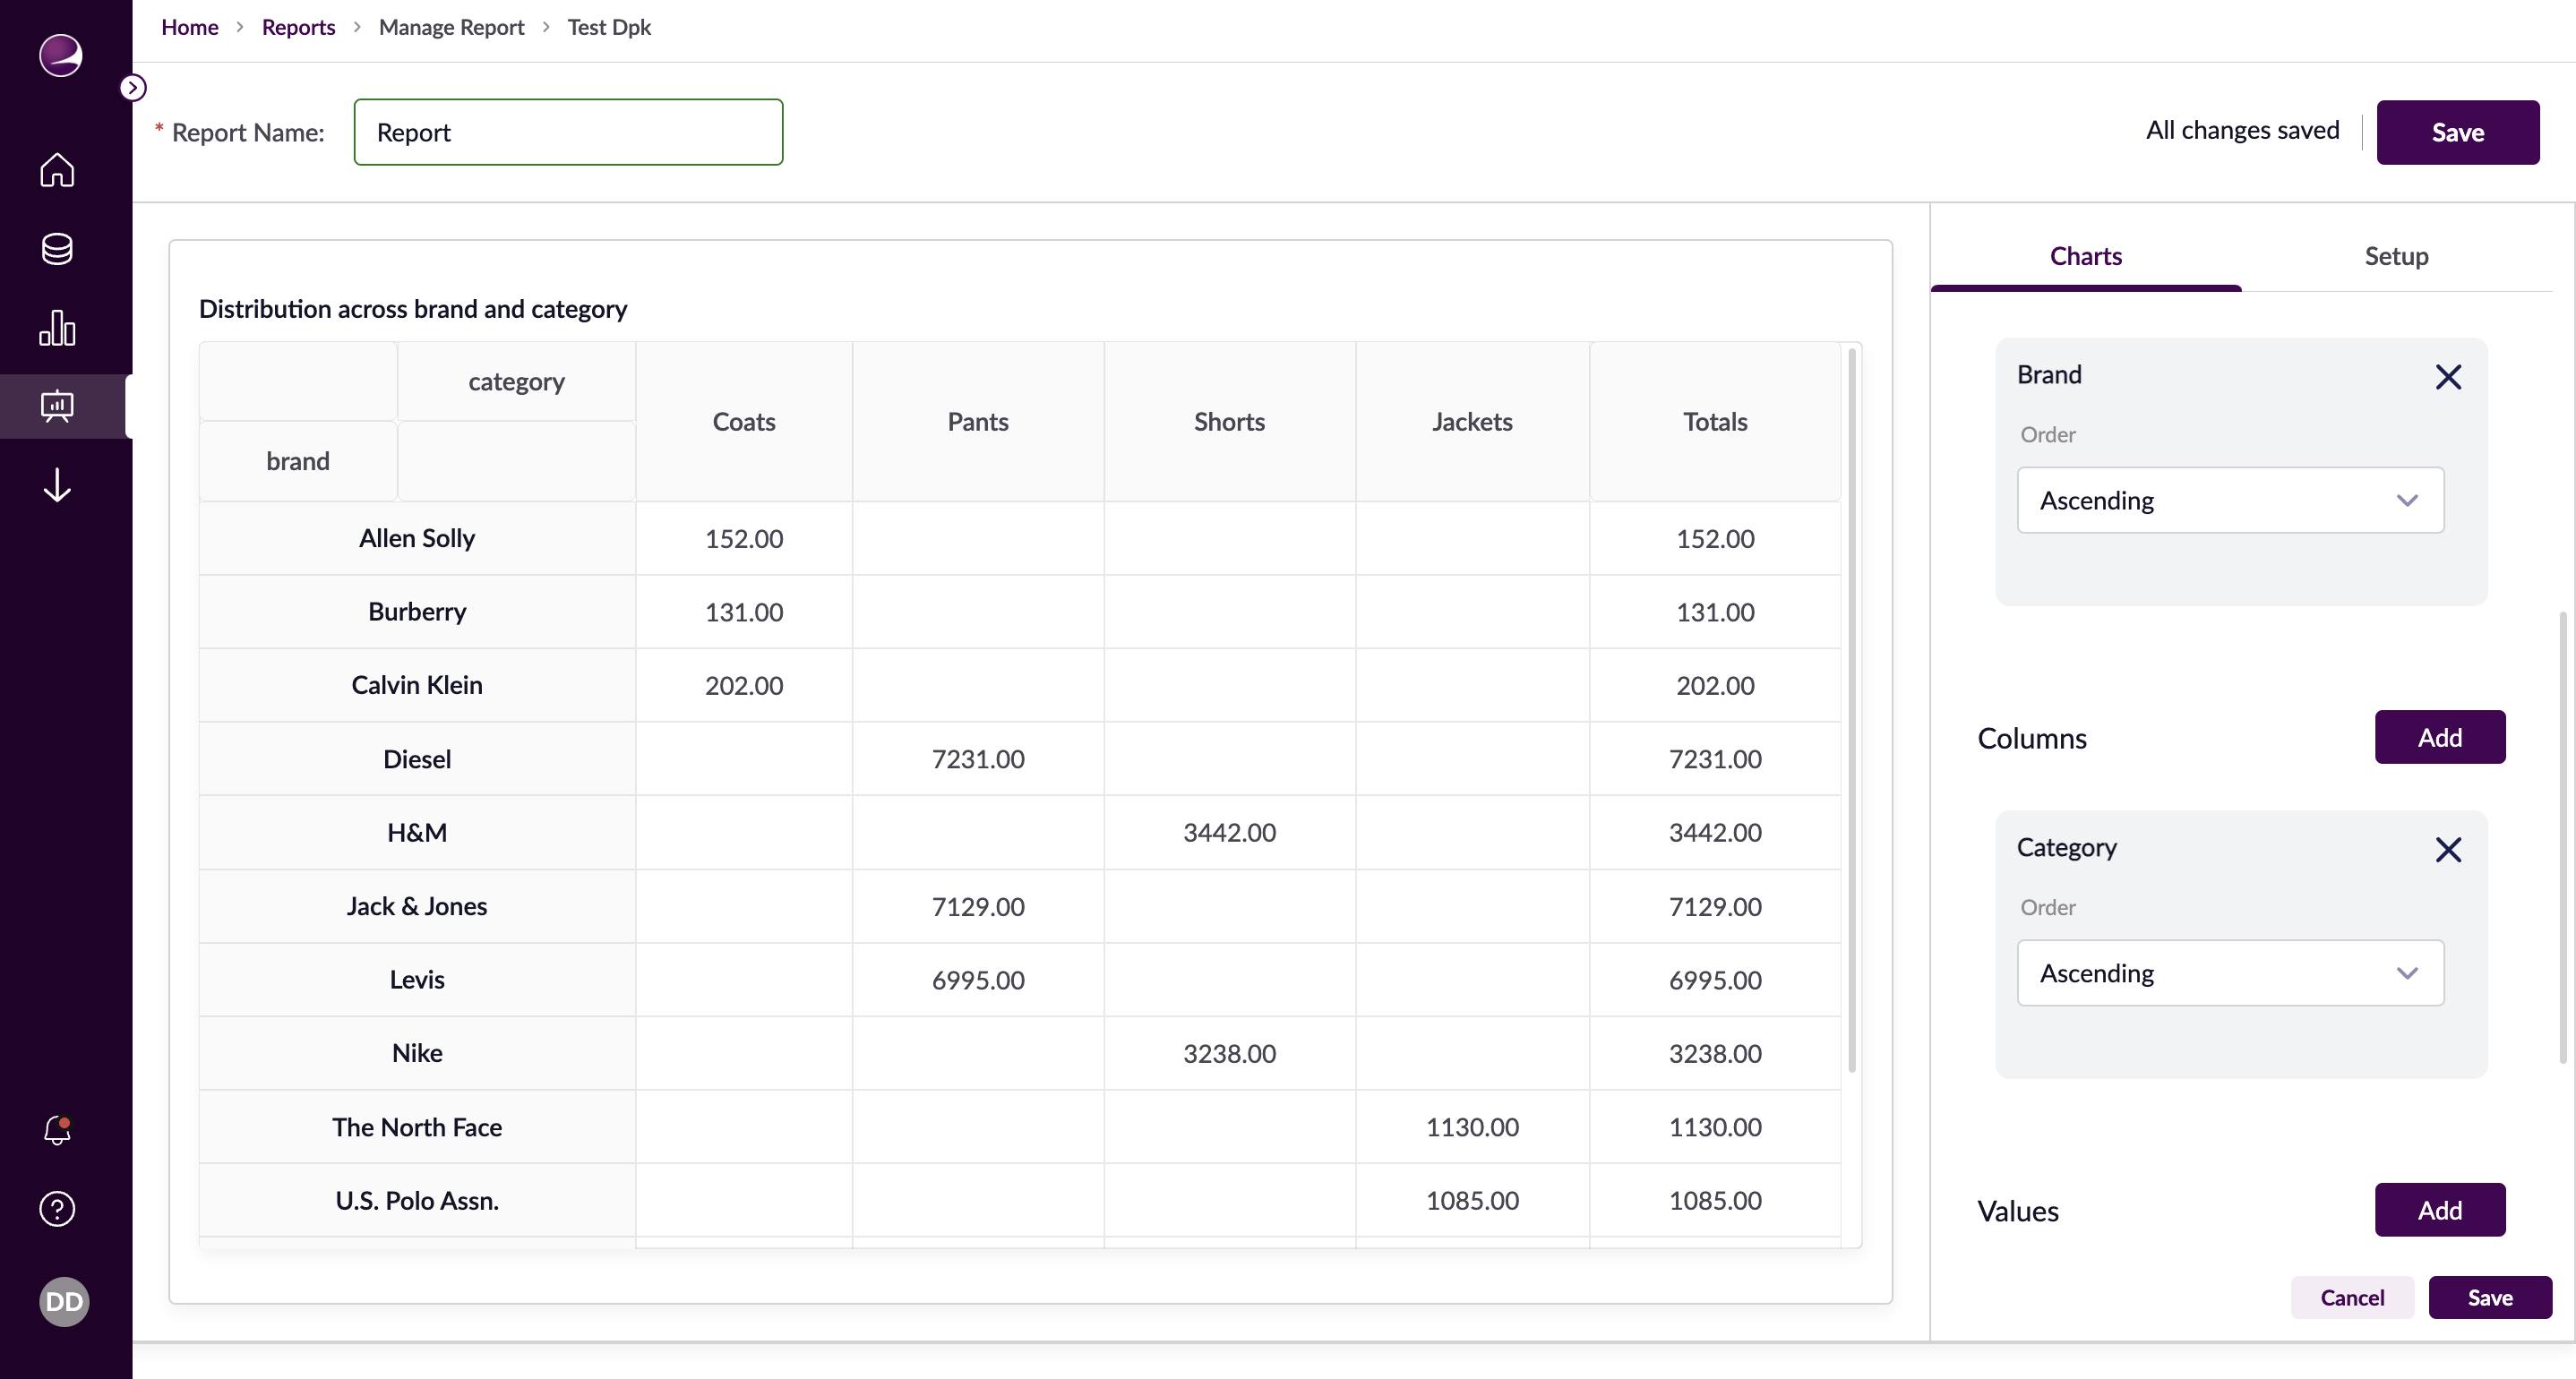
Example Pivot Tables
Brand Distribution Analysis